memtrack and memview - tracking down memory leaks with LD_PRELOAD
This time I want to share a neat application I wrote to track down memory leaks in long-running, multithreaded applications without having to recompile or relink them. It consists of two parts: memtrack, an LD_PRELOAD library that logs every allocation and free, and memview, a curses-based viewer that lets you browse the log and find leaks.
The problem
A memory leak rarely announces itself. The application just grows, slowly, until it either gets OOM-killed or the system grinds to a halt. valgrind [1] is the classic tool for this, but it is heavy, slows the application down by an order of magnitude, and does not really work well for long-running or multithreaded applications where you want to watch things happen live.
-fsanitize=leak is also a nice alternative, but it requires recompiling the target application and is, for my surprising, not available for 32bit ARM.
What I wanted was something that:
- Not required recompilation of the target application
- Showed me allocations and frees as they happen, per thread
- Gives me a leak report without having to kill the application first
- A way to actually browse the data instead of grepping through a log
So I wrote memtrack and memview [2].
memtrack
memtrack is an LD_PRELOAD library:
1LD_PRELOAD=./memtrack.so ./your_appNo recompilation, no relinking, no touching the target's build system at all. To understand why that one environment variable is enough to hijack every malloc call in an arbitrary binary, it helps to look at how the dynamic linker actually resolves symbols.
How LD_PRELOAD actually works
A dynamically linked executable does not contain the code for malloc, printf and friends - it only contains references to those symbols, resolved at load time by ld.so, the dynamic linker. When the loader starts a program, it builds a global symbol table by walking the object's needed libraries (DT_NEEDED entries in the ELF dynamic section) in a well-defined order, and for a call through the PLT (Procedure Linkage Table) it picks the first definition of a symbol it finds in that order.
LD_PRELOAD simply lets you insert one or more shared objects at the very front of that search order, before libc.so and before the executable's own dependencies get a chance to contribute a definition:
1$ LD_PRELOAD=./memtrack.so ldd ./your_app
2        linux-vdso.so.1
3        ./memtrack.so (0x00007f...)
4        libc.so.6 => /lib/x86_64-linux-gnu/libc.so.6
Because memtrack.so also happens to export functions named malloc, free, calloc, and so on, every call to those symbols from the application - and from any other library it loads - resolves to memtrack's version instead of glibc's. The application was never told anything changed; it just calls malloc like it always did, and the loader quietly hands the call to a different implementation. This is exactly the same mechanism people use for mocking library calls in tests, injecting fault behaviour, or replacing a crypto backend - preloading is a completely generic "symbol interposition" facility, memory tracking is just one use of it.
There are a couple of important limits to this trick, both of which shaped how memtrack is built:
- It only works for dynamically linked binaries. A statically linked executable has already had malloc baked into it at link time - there is no PLT indirection left for LD_PRELOAD to intercept. This is why memtrack ships as a .so and the project explicitly does not try to support static binaries.
- The real implementation still has to be reachable somehow, since memtrack's malloc needs to actually allocate memory, not just log a line and return garbage. That's what dlsym(RTLD_NEXT, "malloc") is for: it tells the dynamic linker "give me the next definition of this symbol after the one I'm currently in", i.e. skip past memtrack.so itself and find glibc's real malloc. Every hook in memtrack resolves its "real" counterpart this way, once, and caches the resulting function pointer:
 1static void* (*real_malloc)(size_t) = nullptr;
 2
 3static void resolve()
 4{
 5    real_malloc  = (void*(*)(size_t))       dlsym(RTLD_NEXT, "malloc");
 6    real_calloc  = (void*(*)(size_t,size_t))dlsym(RTLD_NEXT, "calloc");
 7    real_realloc = (void*(*)(void*,size_t)) dlsym(RTLD_NEXT, "realloc");
 8    real_free    = (void(*)(void*))         dlsym(RTLD_NEXT, "free");
 9    /* ... mmap, munmap, mremap, strdup, strndup ... */
10}
RTLD_NEXT is what makes this whole approach composable: it means memtrack.so can itself be preloaded alongside other LD_PRELOAD libraries, each one interposing on the next, without any of them needing to know about each other.
Every allocation and every free is logged with size, thread id, thread name and a timestamp in microseconds. When a thread exits, memtrack prints its cumulative total and a leak report of every pointer that was never freed.
1[memtrack] tid=12345 (worker-1       ) malloc     ts=142        size=128        total=128        ptr=0x55b29f0a8160
2[memtrack] tid=12345 (worker-1       ) free       ts=310        size=128        ptr=0x55b29f0a8160
3[memtrack] tid=12345 (worker-1       ) EXIT       ts=512        total=128   bytes allocated
That is already useful on its own, but a raw log gets unmanageable fast on a real application. That is why the leak detection itself is not done in memtrack - it is done in memview, by replaying the log. memtrack's only job is to be a fast, honest recorder of what happened - and getting that right turned out to have a surprising number of sharp corners.
The penguin-and-egg problem: bootstrapping
The very first call to malloc in a process wrapped this way looks up the real malloc with dlsym(RTLD_NEXT, "malloc"). The problem is that glibc's dlsym itself allocates memory internally - by calling calloc. If my calloc override tries to resolve the real calloc before it exists, it recurses into dlsym again, forever.
The fix is a tiny static bump allocator that services allocations before the real symbols are resolved:
 1static char                  bootstrap_buf[65536];
 2static std::atomic<size_t>   bootstrap_used{0};
 3
 4static void* bootstrap_alloc(size_t size)
 5{
 6    size_t old = bootstrap_used.load(std::memory_order_relaxed);
 7    size_t next;
 8    do {
 9        next = old + size;
10        if (next > sizeof(bootstrap_buf)) return nullptr;
11    } while (!bootstrap_used.compare_exchange_weak(old, next,
12                std::memory_order_relaxed, std::memory_order_relaxed));
13    return bootstrap_buf + old;
14}
It is a simple lock-free bump allocator, guarded with a compare-exchange loop in case two threads hit dlsym concurrently during startup. Memory from it is never actually freed - free() just checks if a pointer falls inside bootstrap_buf and silently no-ops if so. 64 KB is more than enough to get past process start-up.
Avoiding infinite recursion: the in_hook flag
Once the real functions are resolved, there is a second recursion problem: my own logging code needs to format strings and (for stack traces) call backtrace_symbols, both of which allocate memory. If that allocation goes through my hook again, I log my own bookkeeping as if it were the application's memory usage, and potentially recurse forever.
The fix is a thread-local guard flag, checked and set around every real call:
 1static __thread bool in_hook = false;
 2
 3void* malloc(size_t size)
 4{
 5    if (!real_malloc) resolve();
 6    if (in_hook) return real_malloc(size);   // internal call - pass through untouched
 7
 8    in_hook = true;
 9    void* p = real_malloc(size);
10    log_alloc("malloc", size, p);
11    in_hook = false;
12    return p;
13}
Because it is __thread and not a global, one thread doing its own logging never blocks another thread's allocations from being tracked correctly.
Buffered writes, lock-free frees
Every allocation and free normally means a write() syscall, which is expensive if you're churning through thousands of small allocations. Each thread gets its own output buffer (default 4 KB, tunable with MEMTRACK_BUFFER_SIZE) so most events are just a memcpy into a thread-local buffer that gets flushed in one syscall once it fills up - no cross-thread locking needed for that part.
Where a lock is needed is to keep a single allocation's log line and its (optional) stack-trace lines together in the output, since two threads could otherwise interleave their writes. That per-thread mutex only guards the allocation path. The free path is deliberately lock-free, since frees are on the hot path far more often in most workloads.
realloc deserves a special mention, since it can behave as malloc, free, or an in-place resize depending on its arguments. To keep the log consistent regardless of which path glibc takes internally, memtrack always logs the implicit free of the old pointer before calling the real realloc, then logs a fresh allocation for the result - even when the returned pointer is identical to the old one (an in-place grow/shrink).
Catching threads (and processes) that don't say goodbye
Per-thread totals and leak reports are printed from a pthread_key_create destructor, which glibc fires automatically when a thread exits - regardless of whether the leak is the main thread or a worker:
1static void thread_exit_handler(void*)
2{
3    tl_buf.flush();
4    snprintf(buf, sizeof(buf),
5        "[memtrack] tid=%-6d (%-15s) EXIT ts=%-12llu total=%-12zu bytes allocated\n",
6        tid, get_thread_name(), elapsed_us(), thread_total);
7    outfd_write(buf, n);
8}
The main thread is a special case though - glibc does not reliably run pthread-key destructors for it when the process exits via exit() or main() returning. An atexit handler covers that gap, and also closes (or, for TCP connections, shuts down the write side of) the output file descriptor, which signals a clean EOF to a live memview session so it knows the stream is really done.
If the process is instead killed outright (SIGKILL), none of this runs at all - there's simply no hook for that. memview handles it by treating anything still unfreed at EOF as a leak.
mmap and the sized-delete detail
Anonymous mmap regions are tracked the same way as heap allocations (file-backed mappings are deliberately skipped, since they are not really "your" memory). mremap is logged as a free of the old mapping followed by an alloc of the new one, so the accounting always balances even though it is technically one call.
C++14 added sized operator delete(void*, size_t) overloads, which the compiler may silently prefer over the unsized ones. Missing those means silently under-counting frees for anyone still on modern compilers, so memtrack overrides both the sized and unsized forms for delete, delete[], and their nothrow variants.
Leak reconciliation across threads
The one thing I did not think about until I hit it: what happens when thread A allocates something, exits (and gets reported as a leak, since nobody has freed it yet), and then thread B frees that same pointer later on? This happens all the time with worker pools and handoff patterns.
memtrack does not try to solve this itself - it just logs what happens, in order, and stays completely stateless (no in-memory map of live allocations, which also means zero per-allocation heap overhead on the tracked application). It is memview that reconstructs the full lifecycle by replaying the log and matching ptr= fields, using line order to decide what happened when. If a free for a given pointer appears after that pointer's owning thread already logged an EXIT, memview simply clears the leak flag it had set - the pointer was never actually lost, just handed off.
Optional stack traces (MEMTRACK_STACK_DEPTH) with automatic C++ demangling are available too, at a real cost - 10-100 µs per call via backtrace() - so they are off by default and can be scoped to specific threads with MEMTRACK_STACK_THREADS to keep the overhead localized to the code path you actually care about.
memview
This is the part I spent the most time on. memview is an ncurses TUI that reads a memtrack log - from a file, from stdin, or live over TCP from a running process - and lets you actually work with the data instead of scrolling through it.
1# Capture to a log file, then open the viewer
2MEMTRACK_OUTPUT=run.log LD_PRELOAD=./memtrack.so ./your_app
3./memview run.log
4
5# Or watch it live while the application is still running
6MEMTRACK_PORT=4242 LD_PRELOAD=./memtrack.so ./your_app &
7./memview :4242
The main view is a scrollable table of all allocations and frees, with a live summary of total memory usage per thread in the header. You can filter by thread, by allocation size, or by a range of timestamps, and you can jump to the first or last allocation for a given pointer to see its full lifecycle.
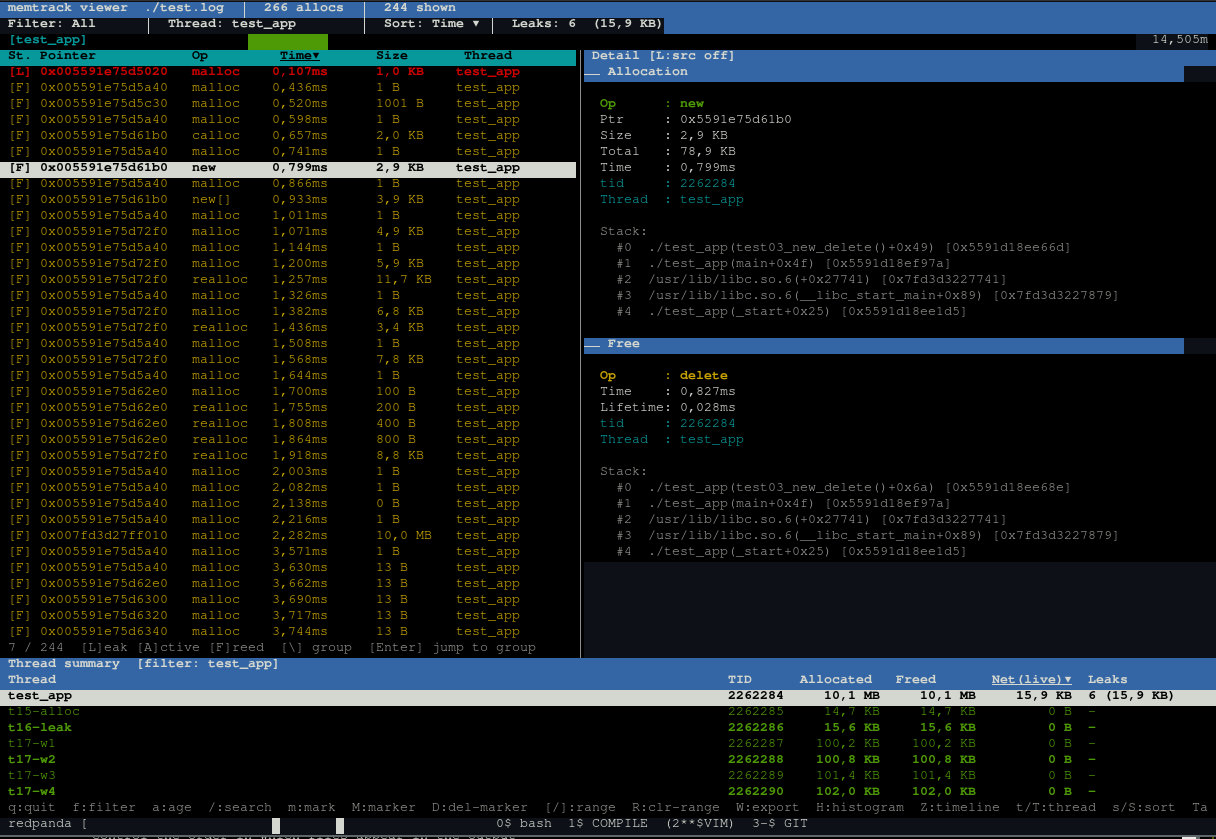
There is also a size histogram (H), markers and a range filter (M, [ / ]) for isolating exactly what a single operation allocates, and a timeline sparkline in the header that shows live memory over the whole session at a glance.
It actually supports a lot more than that, check the README [4] for the full list of features.
Built with help of Claude
I mentioned before [3] that I have been experimenting with letting Claude write code for me. memtrack is actually most of my own work, but memview on the other hand is more written by Claude than by me. Writing a TUI is far from what I enjoy doing, and it would have taken me ages to get right by hand, and it is exactly the kind of fiddly, well-specified UI work that an AI handles well.
It also helped me writing the test suite.
Summary
We actually found the leak in our application by using this tool. Deep down in a thread that were using a poorly documented API, we were leaking memory every time there was any activity on DBUS. Not too obvious to find, and I think it would have taken us way too longer to find it without this tool.
You find the code on Github [2].