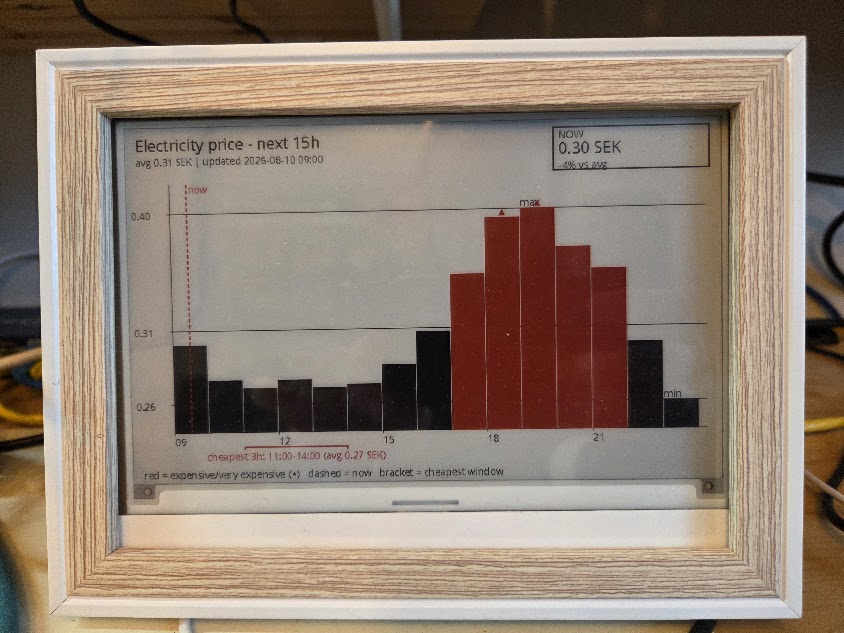
Electricity price on an e-Paper display
I've written before about how much the electricity price varies here in Sweden during the day [1]. It's usually cheapest at night and most expensive in the morning and evening, but "usually" is doing a lot of work in that sentence - some days it's the exact opposite, and every now and then a price spike will make an hour or two absurdly expensive.
I wanted to be able to see the current price and the next few hours at a glance without having to open an app on my phone, so that is why I built a small e-Paper display that shows the current price, the next 48 hours, and highlights the cheapest three-hour window.
Hardware
I bought a Waveshare 7.5 inch e-Paper B display (the black/white/red three-colour one) [4] and took a Raspberry Pi Zero 2W I had lying around from a previous project.
Waveshare publish all their drivers and examples in one big repo [2], which is a great starting point.
Getting the data
Tibber, my electricity provider, has a genuinely pleasant GraphQL API [3]. A single query gets you every hourly spot price for today and tomorrow (tomorrow's prices show up once the grid operator publishes them, usually early afternoon), and Tibber also classifies each hour with a level: VERY_CHEAP, CHEAP, NORMAL, EXPENSIVE or VERY_EXPENSIVE. That saved me from having to invent my own "is this expensive" heuristic.
Designing the chart
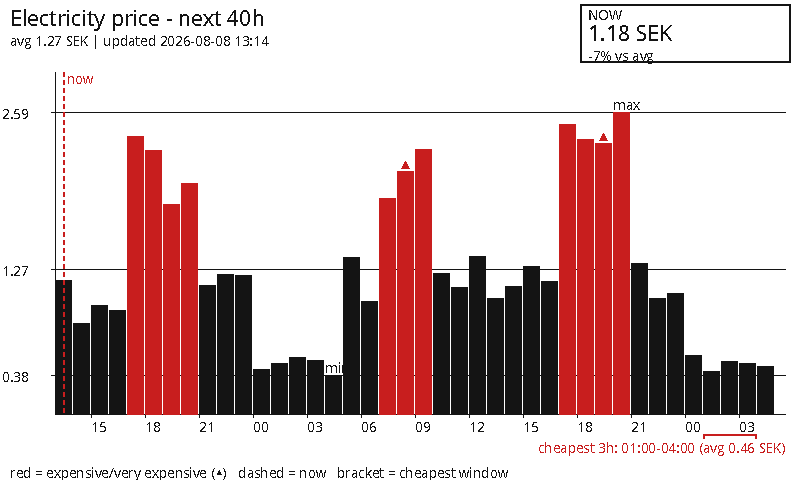
- Bars are black by default, and turn red only when Tibber marks that hour EXPENSIVE or VERY_EXPENSIVE - a small red triangle on top additionally flags the "very" ones.
- A dashed red line marks "now", so I can immediately see where in the 48 hours I currently am.
- A red bracket under the cheapest three-hour window shows the best time to run something power-hungry, e.g. "cheapest 3h: 01:00-04:00 (avg 0.46 SEK)". It's a straightforward sliding-window minimum over the hourly prices.
- A boxed callout in the top-right corner always shows the current price and how it compares to the 48-hour average - this switches to the red layer automatically if the current hour itself happens to be expensive.
Running it every hour
The script fetches the prices, renders the chart with Pillow, and pushes it to the display through Waveshare's Python driver. Since the price only updates once an hour, I use a systemd timer to run it every hour. The timer unit looks like this:
Try it out
The code is available on GitHub [5], and you can run it on any Raspberry Pi with a Waveshare e-Paper display. You will need to set up a Tibber developer account and get an access token to use the API.
You find installation instructions in the README.
The result
Here is the result!
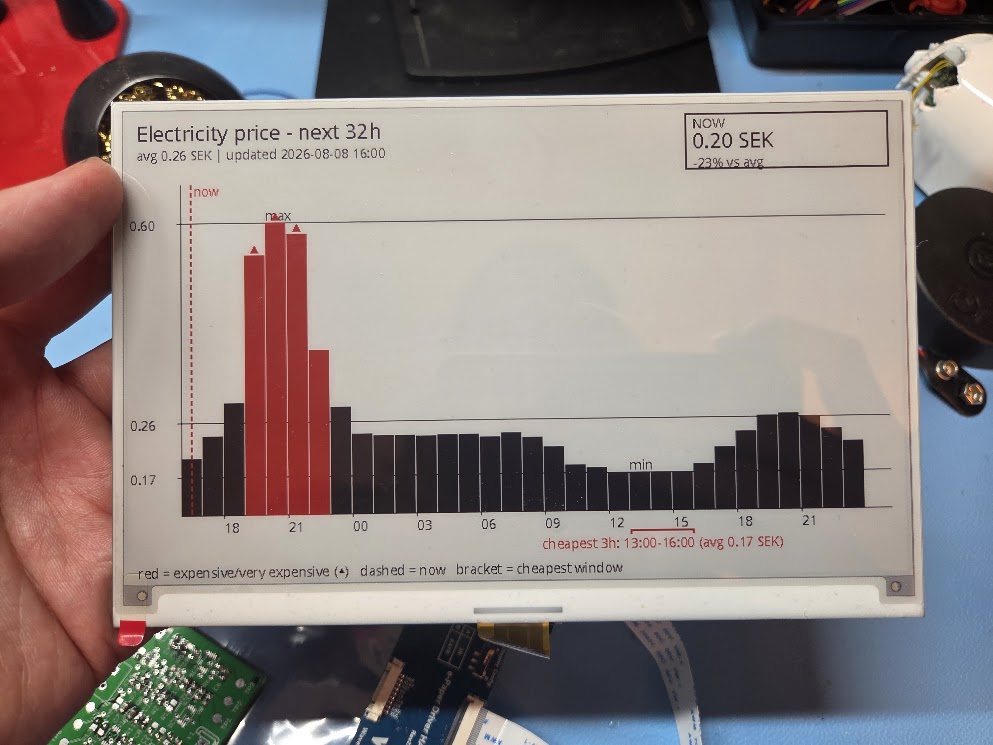
I put it in a simple frame to have on my desk :-)